What the analysis of a real company looks like
This analysis was prepared for Ebonit S.A. — Rosario, abrasion- and corrosion-resistant rubber and polyurethane linings — and is published with the company’s permission. The projects, dates, buyers, rules, calculations and sources in it are the ones used in the work we delivered.
It is the two-page executive summary the company received, in its version of 2 October 2026: it is not updated along with the site, so its figures are the ones from that date. What is our own estimate is marked. The source of every figure is in the full report, which is not published. A correction: earlier versions said that all 18 plants buy rubber lining and started with Timbúes, Sidersa, Los Azules and Milicic. Once the technical study of each plant was opened, four use it, ten may use it and four do not; the Los Azules tanks are fibreglass, Sidersa does not use it and Milicic does earthworks and polyethylene pipe. This version starts with the four that use it. The document is in Spanish: it is the one delivered to the company, and it is not translated.
Three parts of the analysis, up close
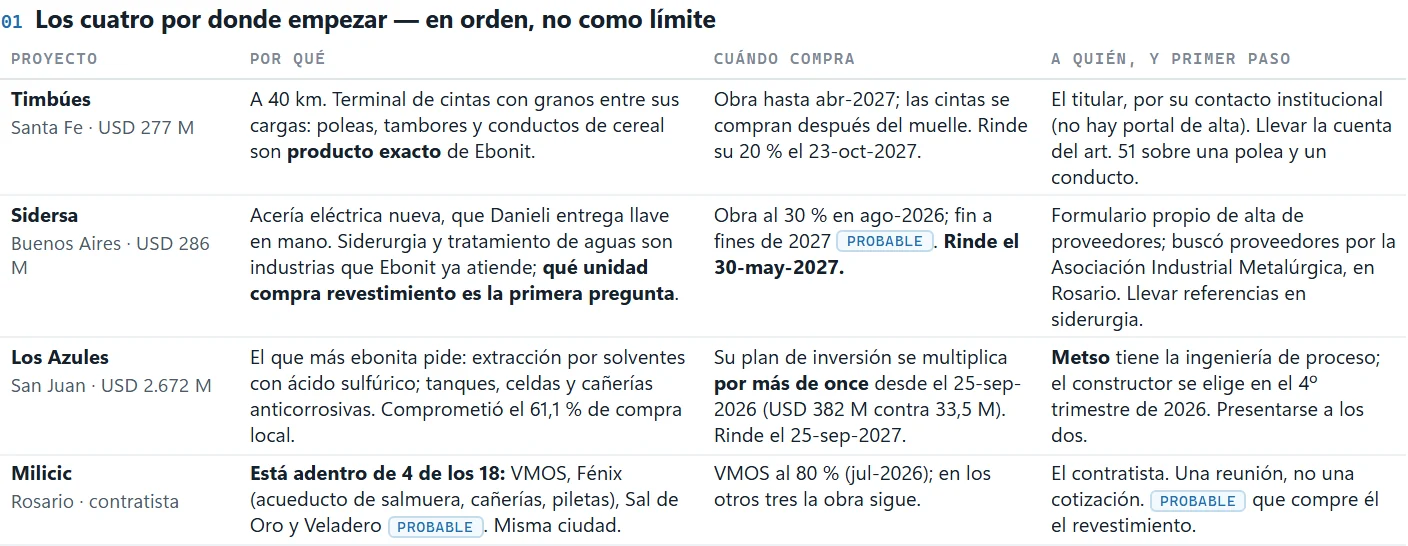
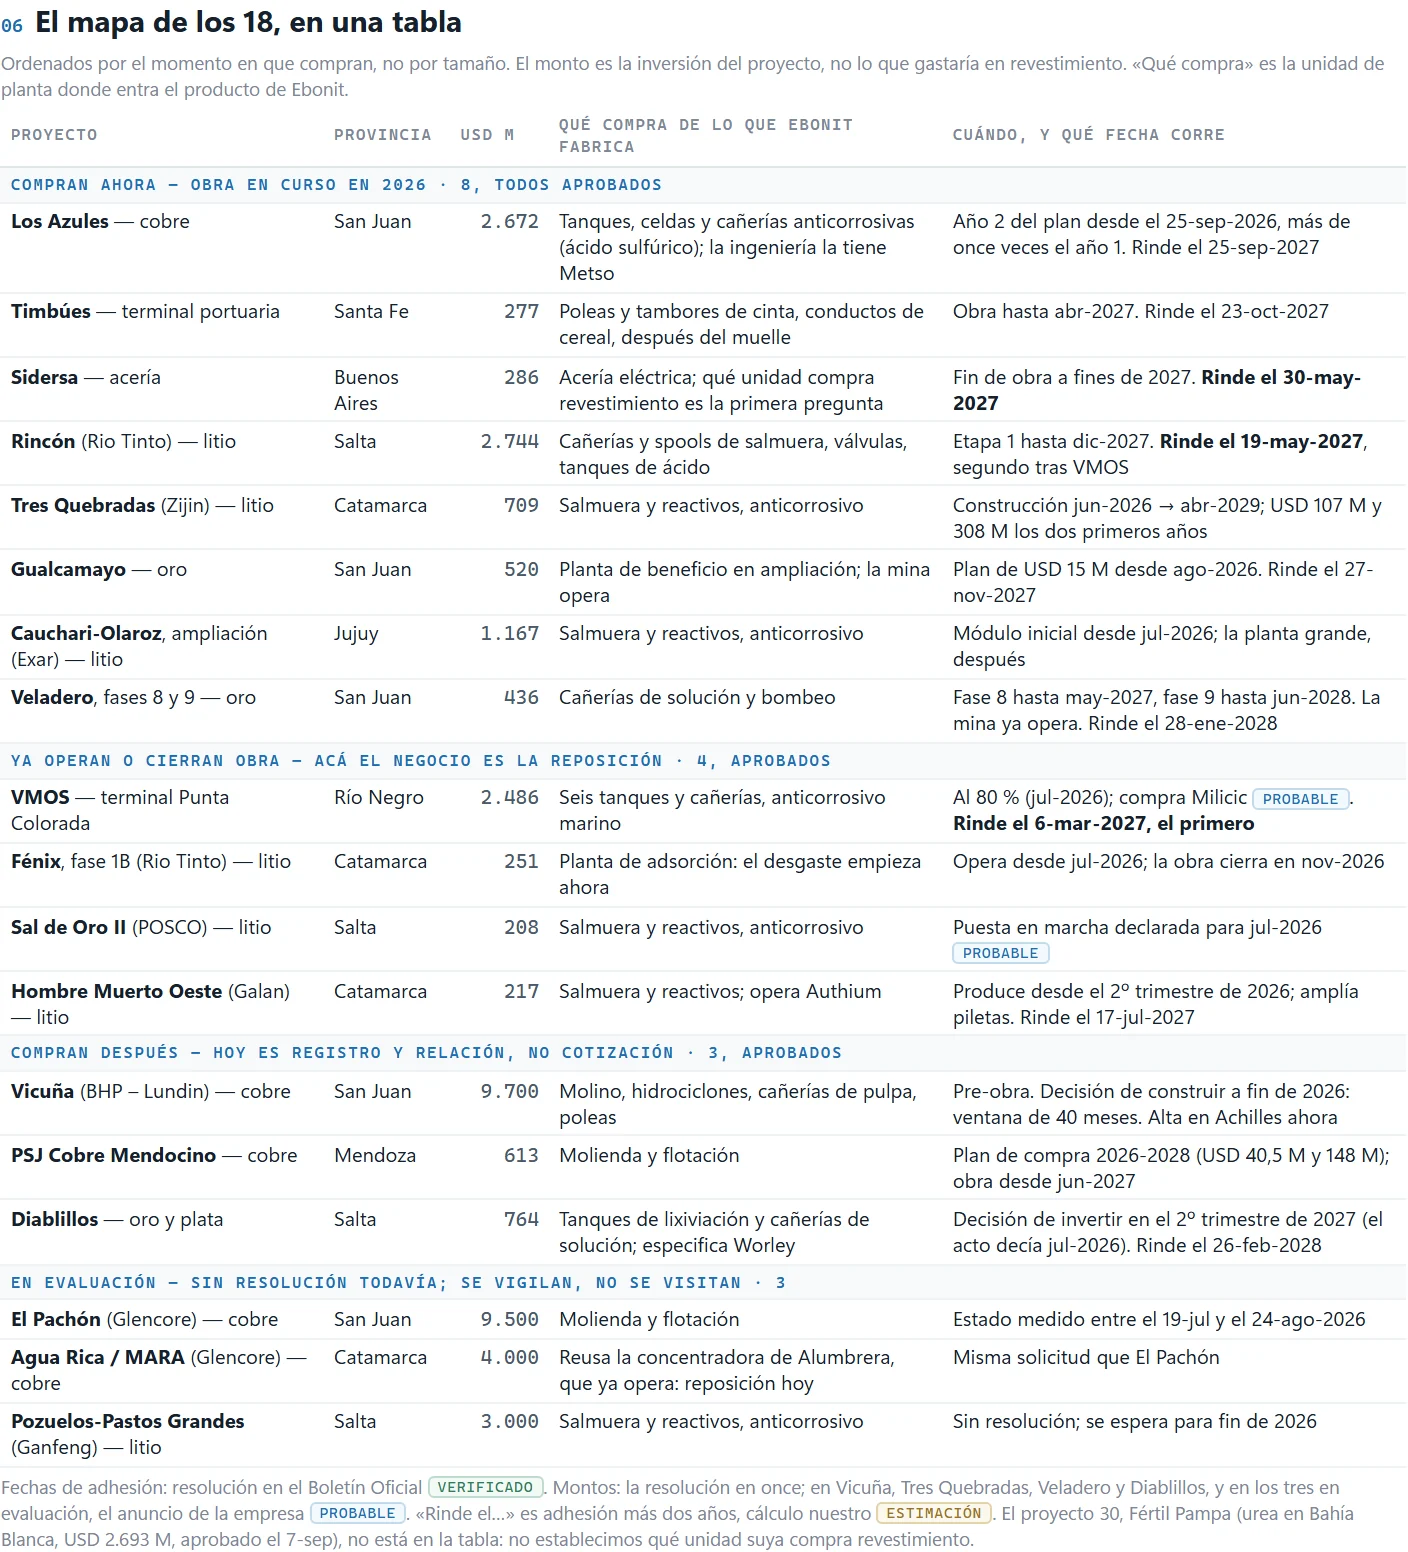
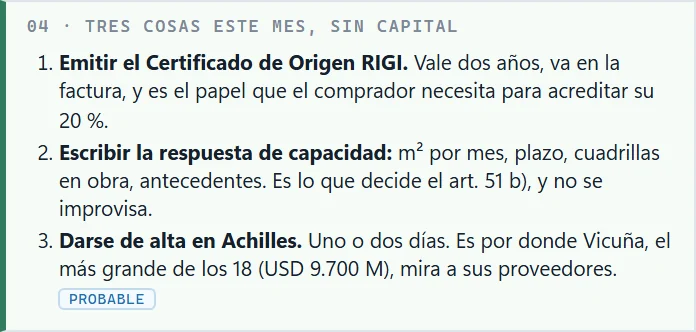
Both pages, in full
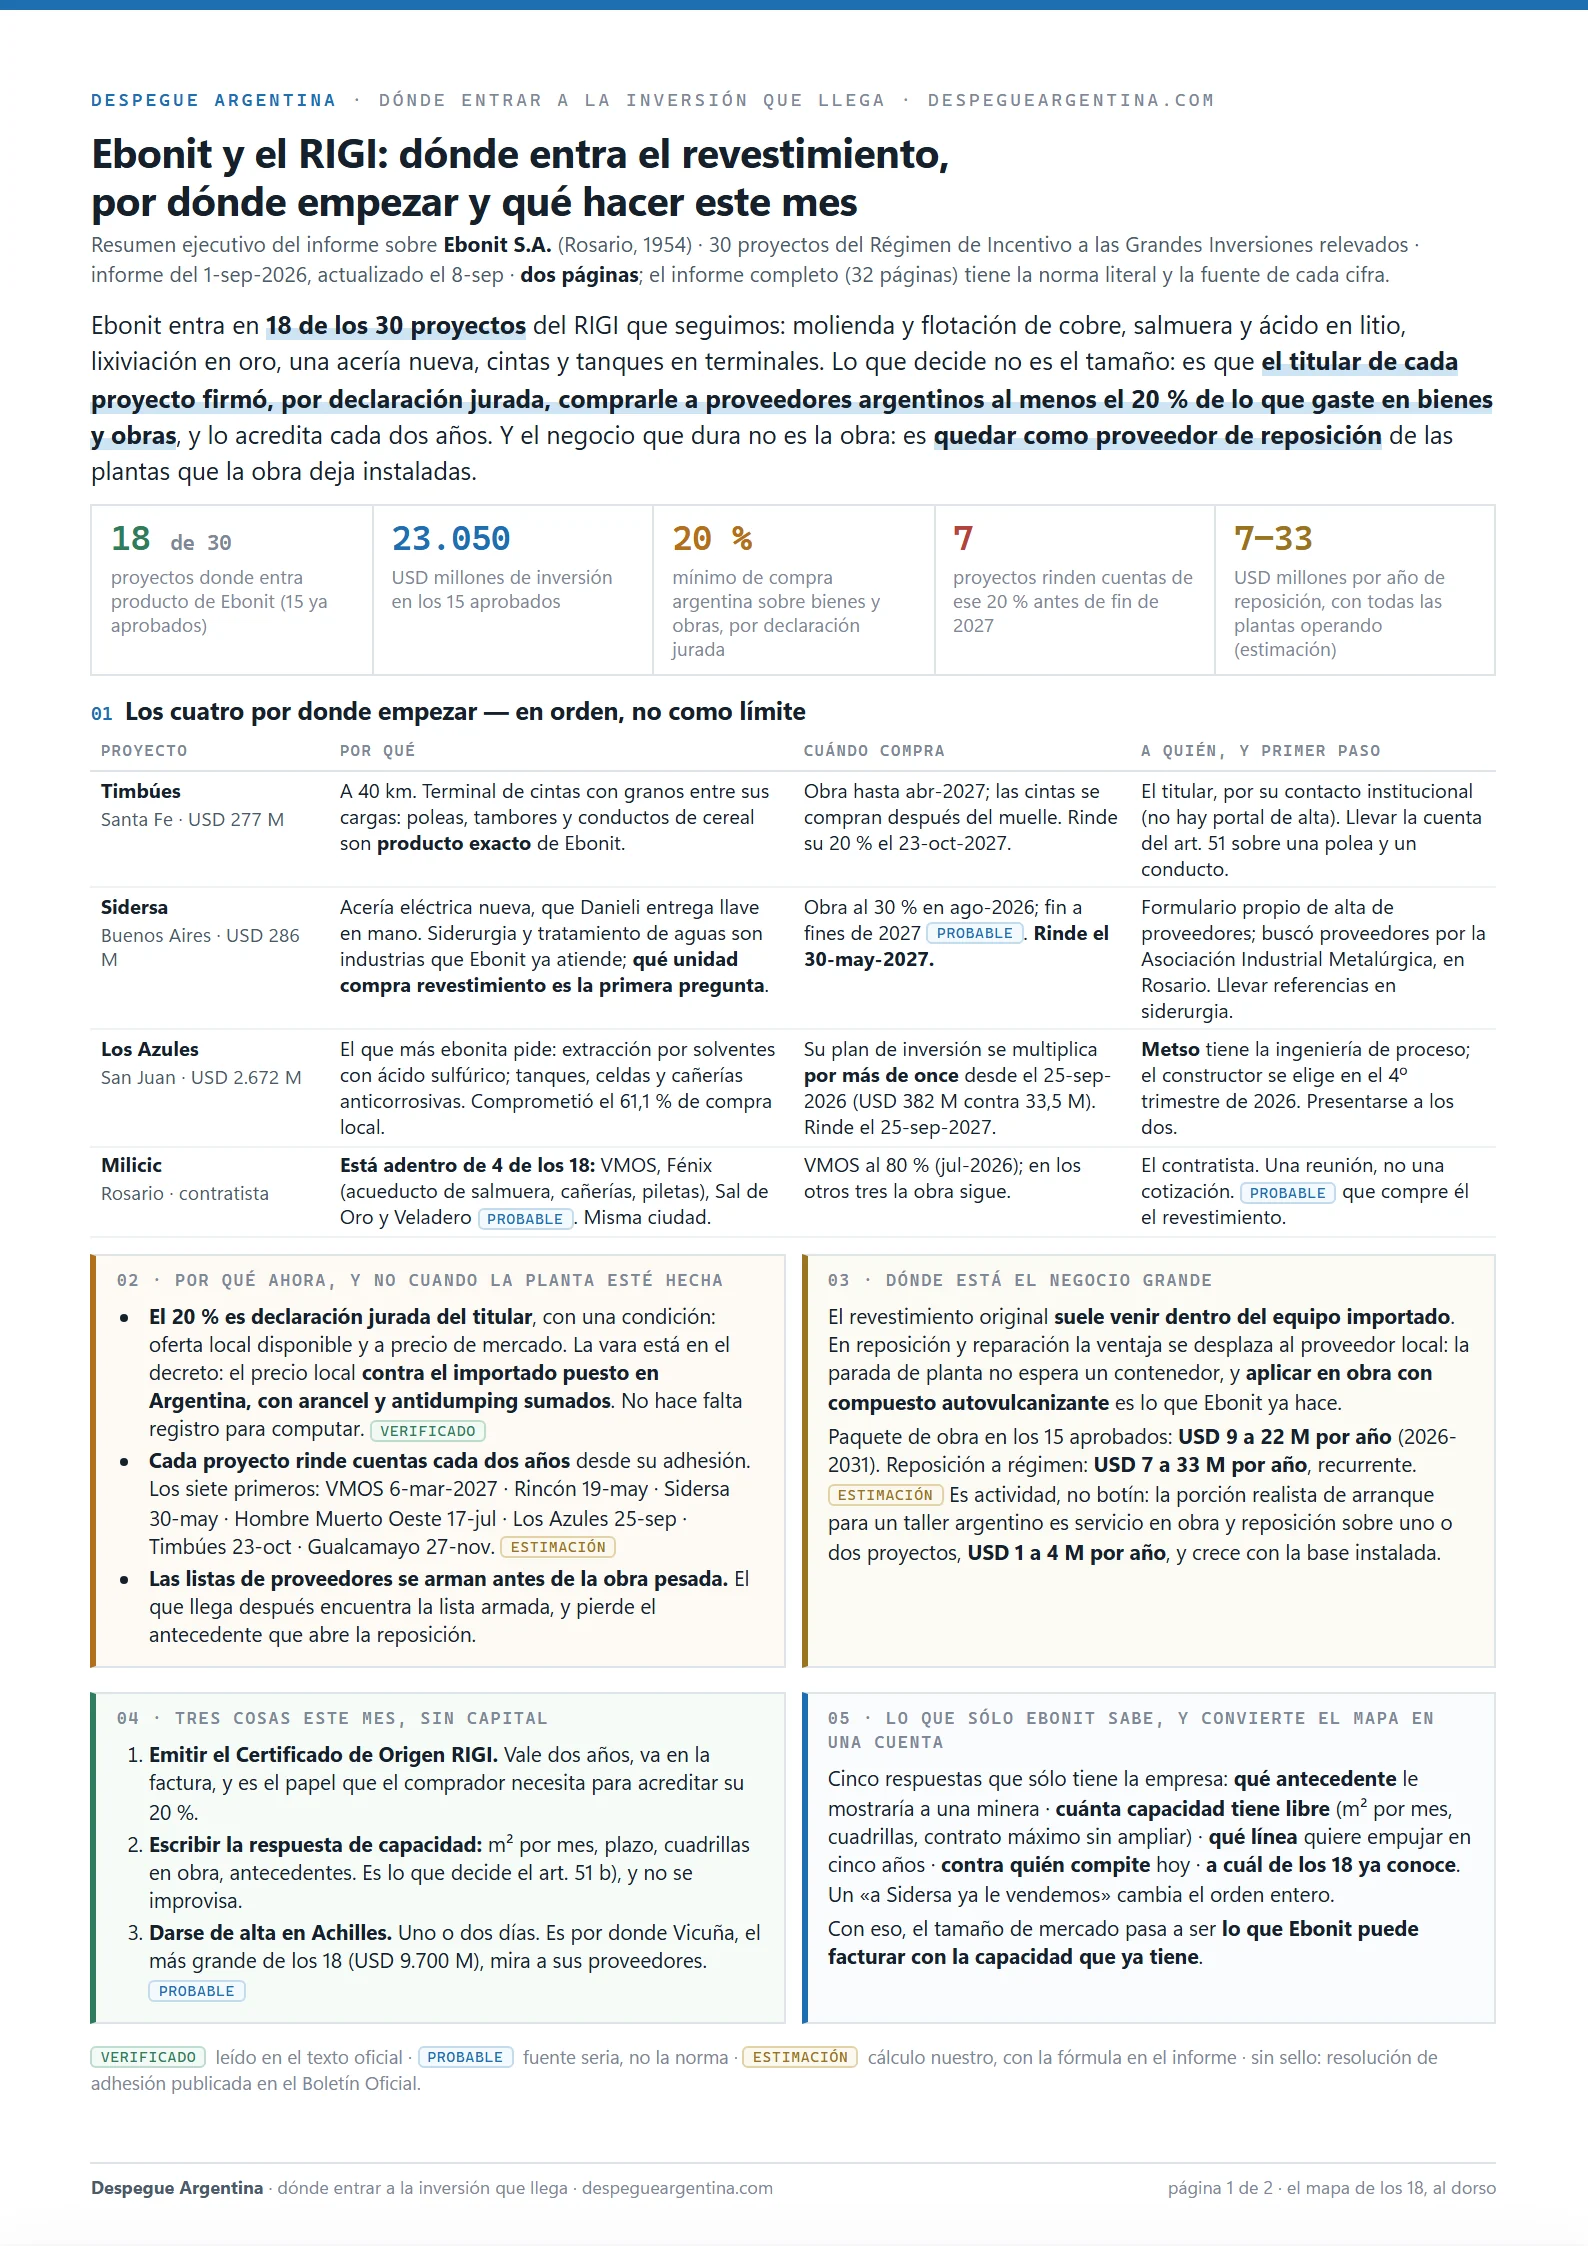
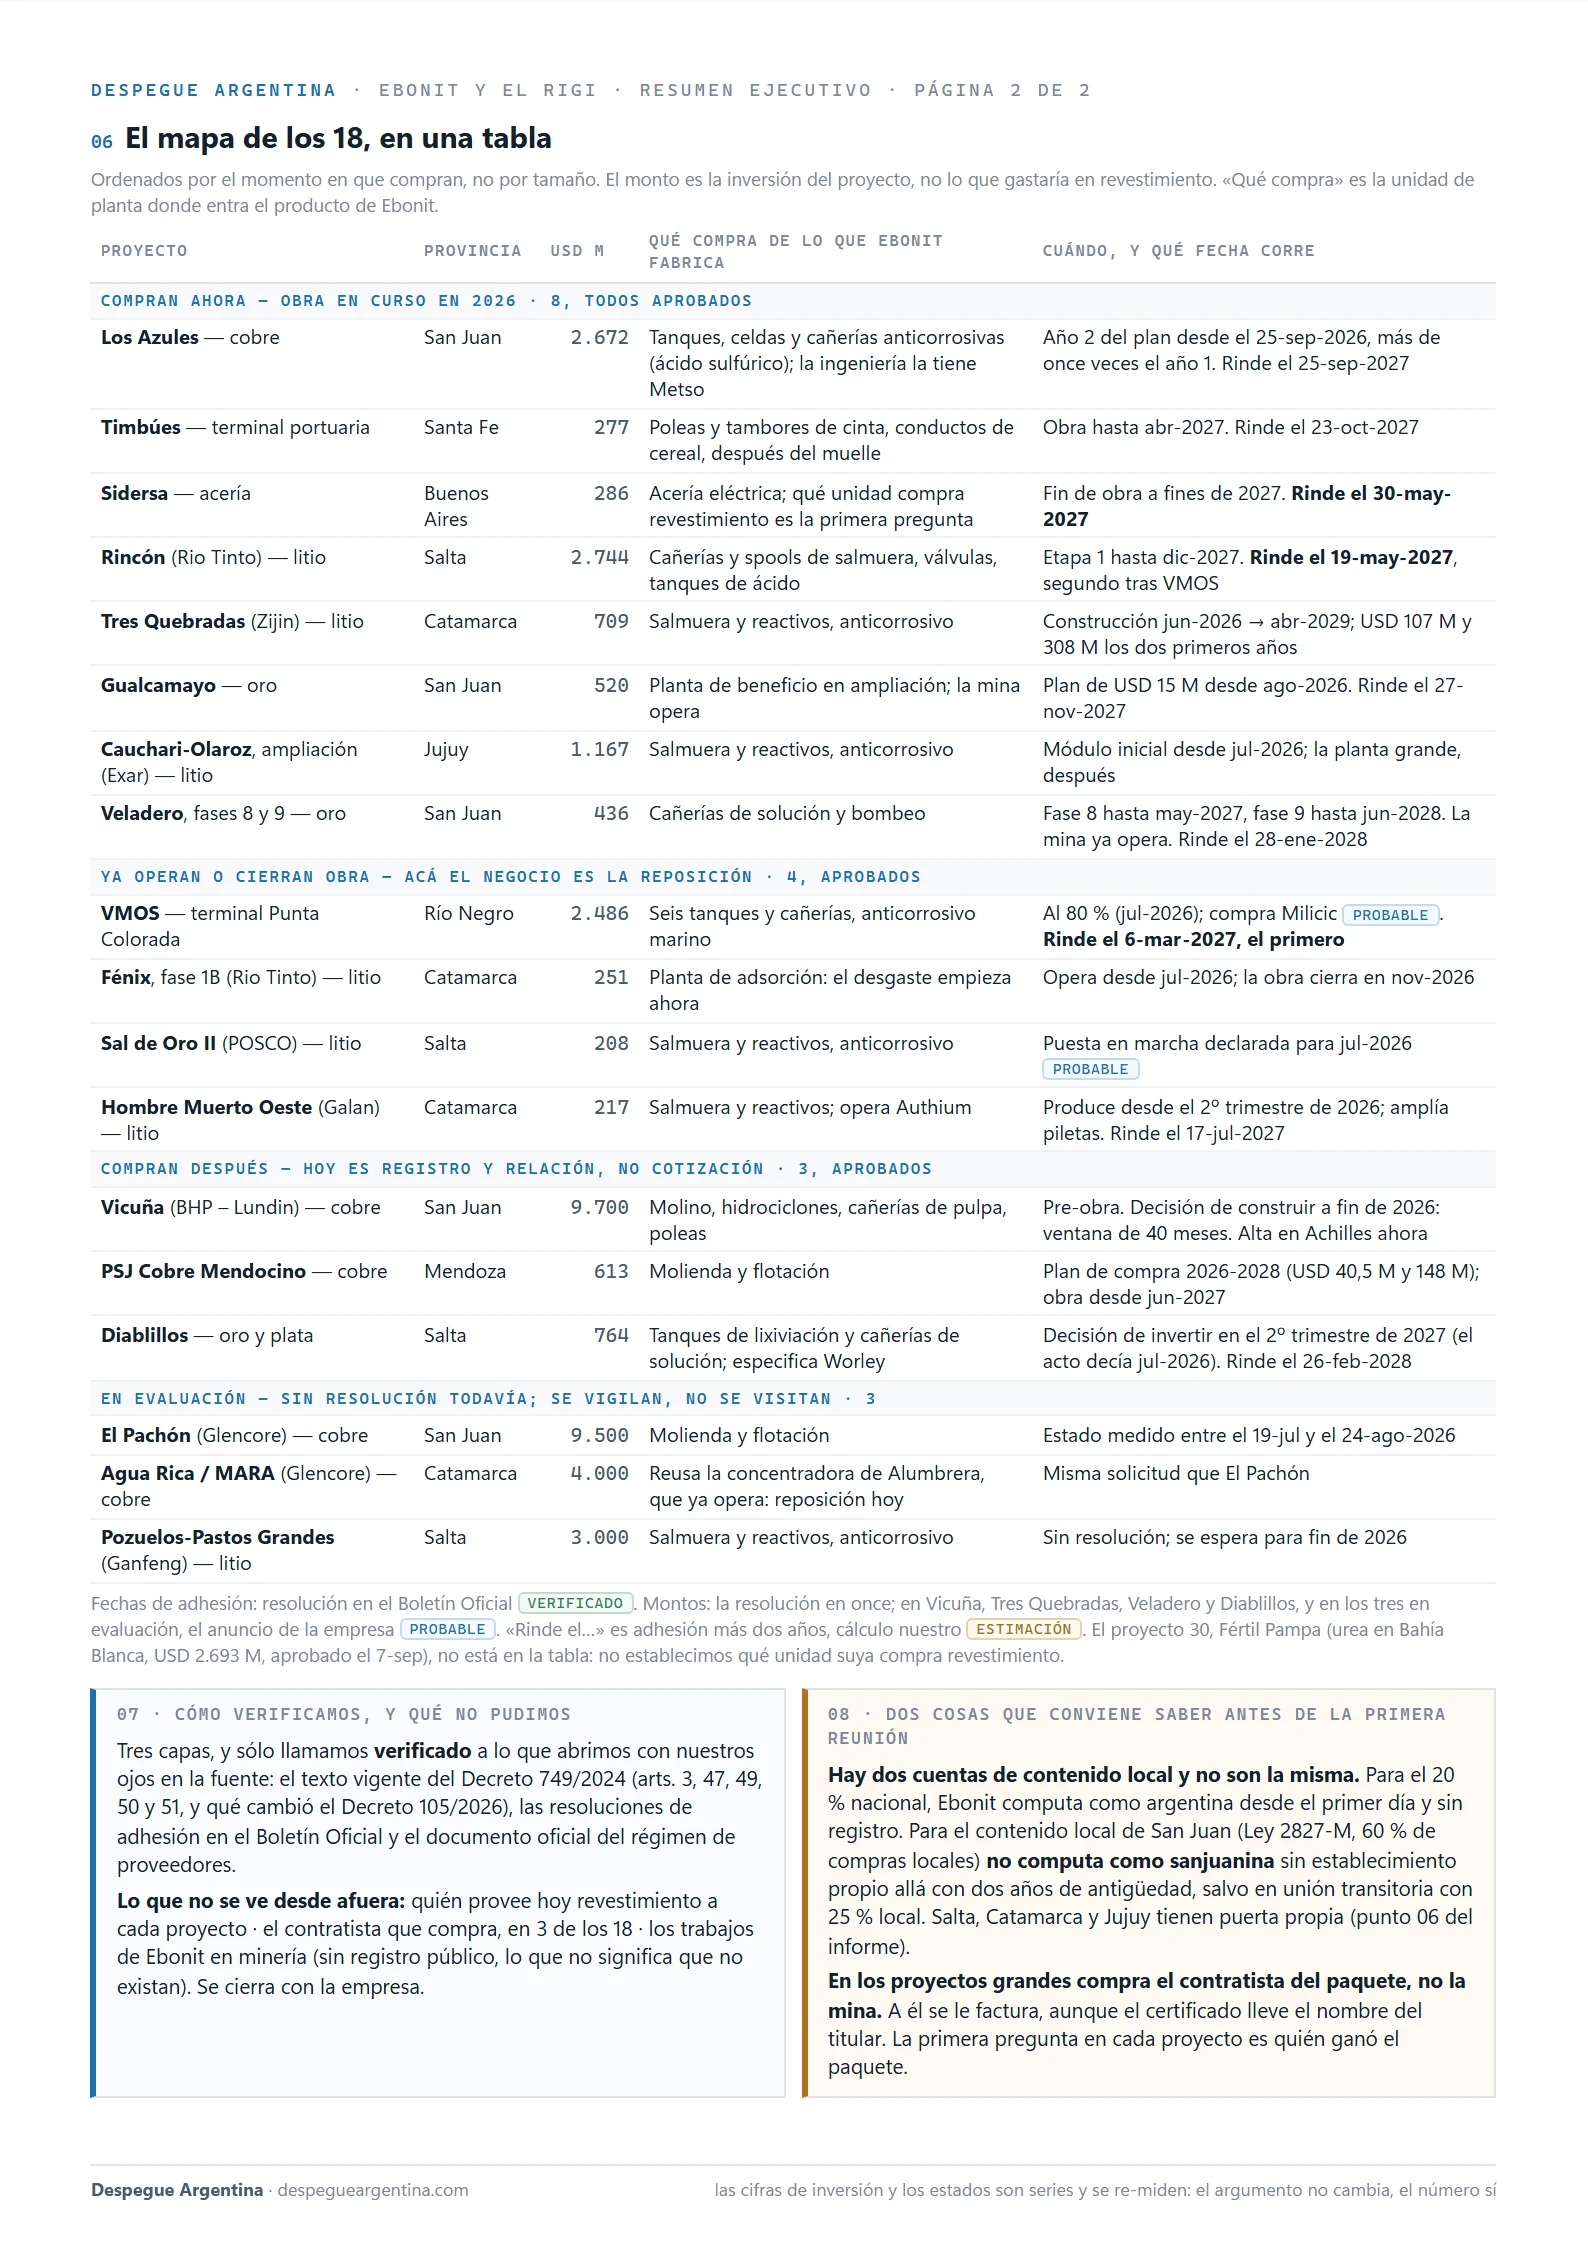
Open the whole analysis (to print or save as PDF) · Tap or click a page to read it at full size.
The same thing, crossed with your company
We do not start from a generic list of opportunities. We start from what a company makes or sells and cross it against projects, buyers, phases, rules and requirements to find where it is worth looking first.
This case shows work done for one specific company. Another company’s result may be different: it depends on what it does, its capacity, the territory, the requirements and when each project buys.
You can also see the example prepared for a fictitious company, where we show the full format of the deliverable more freely. See the fictitious example →